plot: A plotting library, exportable as eps/pdf/svg/png or renderable with gtk
A package for creating plots, built on top of the Cairo rendering engine.
An ambitious attempt to replace gnuplot.
Monadic actions are used to configure a figure, which is a (rxc) array of subplots. Each plot displays a graph with optional heading, labels, legend, and annotations. The annotations themselves may be used to draw diagrams.
A figure is preprocessed in preparation for rendering by the Cairo renderer. The Cairo library can be used to output the figure to PS, PDF, SVG, and PNG file formats, or to display the figure in a GTK Drawable context. (see package 'plot-gtk').
The preprocessed figure can be embedded as an arbitrary Cairo render, including in a diagram
created with the diagram package. Conversely, arbitrary Cairo renders can be embedded in
the data region of a Figure.
The data series are type Data.Packed.Vector from hmatrix, which, when hmatrix is compiled with '-fvector', is a synonym for Data.Vector.Storable from the vector package and are thus compatible with packages such as statistics.
The example in Graphics.Rendering.Plot can be viewed at http://code.haskell.org/plot/examples/perturbed-sine.png
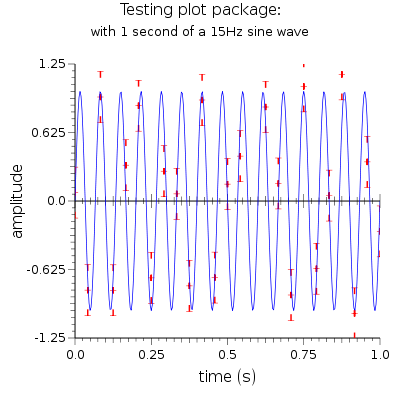
Changes in plot 0.1.1
added candle and whisker plots
Changes in plot 0.1.2
axis join rendering improvement
added annotations
grid lines formattable
Changes
[Skip to Readme]

Modules
[Index]
Downloads
- plot-0.1.3.2.tar.gz [browse] (Cabal source package)
- Package description (as included in the package)
Maintainer's Corner
For package maintainers and hackage trustees
Candidates
| Versions [RSS] | 0.1, 0.1.1, 0.1.1.1, 0.1.1.2, 0.1.1.3, 0.1.1.4, 0.1.2, 0.1.2.1, 0.1.2.2, 0.1.2.3, 0.1.2.4, 0.1.3.0, 0.1.3.1, 0.1.3.2, 0.1.3.4, 0.1.3.5, 0.1.4, 0.1.4.1, 0.1.4.2, 0.1.5, 0.1.5.1, 0.1.6, 0.1.7, 0.1.7.1, 0.1.8, 0.2, 0.2.1, 0.2.2, 0.2.3, 0.2.3.1, 0.2.3.2, 0.2.3.3, 0.2.3.4, 0.2.3.5, 0.2.3.6, 0.2.3.7, 0.2.3.8, 0.2.3.9, 0.2.3.10, 0.2.3.11, 0.2.3.12 |
|---|---|
| Change log | CHANGES |
| Dependencies | array, base (>=4 && <5), cairo (>=0.11.1 && <0.13), colour (>=2.2.1 && <2.4), hmatrix (>=0.10), MaybeT, mtl (>2), pango (>=0.11.2 && <0.13) [details] |
| License | BSD-3-Clause |
| Copyright | (c) A.V.H. McPhail 2010 |
| Author | Vivian McPhail |
| Maintainer | haskell.vivian.mcphail <at> gmail <dot> com |
| Category | Graphics |
| Home page | http://code.haskell.org/plot |
| Source repo | head: darcs get http://code.haskell.org/plot |
| Uploaded | by VivianMcPhail at 2011-06-04T05:48:03Z |
| Distributions | |
| Reverse Dependencies | 5 direct, 0 indirect [details] |
| Downloads | 33435 total (132 in the last 30 days) |
| Rating | (no votes yet) [estimated by Bayesian average] |
| Your Rating | |
| Status | Docs uploaded by user Build status unknown [no reports yet] |