Counting colors in images
=========================
This Haskell package contains functions for counting colors in images, either from a file or a camera feed. The input image must in a standard format like JPEG or PNG. The analyze function outputs the RGB and CIE-LAB values for each pixel, along with the color detected there. The tally function outputs a histogram of the colors detected. The quantize function outputs an image where the pixels have been replaced by the colors detected there.
A command-line tool for detecting and tallying colors is also provided.
Please report issues at <>.
Example
-------
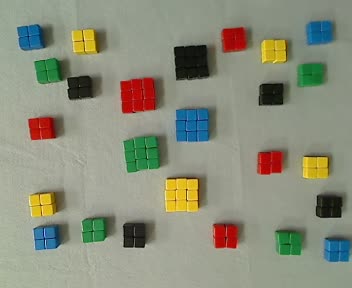
In this example we use [blank colored dice](http://www.amazon.com/dp/B00BNWGVDO) on a gray felt background:
We can process this file using the command-line tool:
```bash
color-counter --analyze=analysis.tsv --tally=tallies.tsv --quantize=quantized.png data/sample.jpg
```
The tally of pixels is as follows:
| Color | Pixels | Efficiency [pixels/cube] |
|--------|--------|-------------------------:|
| black | 3222 | 128.88 |
| blue | 3285 | 131.40 |
| green | 3972 | 154.88 |
| red | 3738 | 149.52 |
| yellow | 4156 | 166.24 |
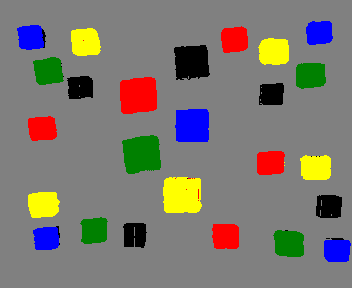
One can see that edge and shading effects cause the detection efficiency to vary by color. The following image shows where colors are detected:
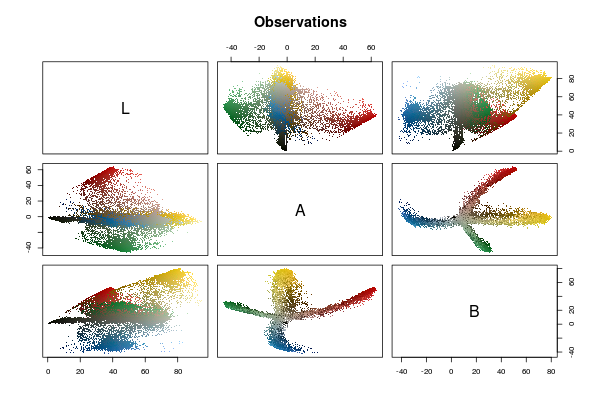
Some simple R code can be used to look at the observed pixels in CIE-LAB space, and then compare that to the classification of those pixels:
```R
require(data.table)
analysis <- fread("analysis.tsv")
analysis[, RGB:=rgb(Red/255,Green/255,Blue/255)]
pairs(analysis[, .(L, A, B)], col=analysis$RGB, pch=".", main="Observations")
pairs(analysis[, .(L, A, B)], col=analysis$Color, pch=".", main="Classifications")
```

Calibration
-----------
The calibration parameters are stored in the `ColorConfiguration` data type of the `Vision.Image.Color.Detection` module. It contains a default color and a list of `ColorSpecificiation` entries, one for each color to be detected. All colors must be specified by their [SVG names](https://www.w3.org/TR/SVG/types.html#ColorKeywords).
The `ColorSpecification` entries define the color being detected and a half plane in [CIE-LAB color space](https://en.wikipedia.org/wiki/Lab_color_space#CIELAB). The color is considered "detected" when it lies deeper than the specified threshold into the half plane defined by the specified vertex and direction. (The threshold parameter is redundant mathematically with the vertex location, but it is convenient to have such a parameter to make it easy to make minor adjustments to calibration.) When an observation lies in the half planes for several colors, it is assigned to the one in whose half plane it is deepest. We have found that calibration using this method of CIE-LAB half planes is robust under widely different lighting conditions. (Eventually, we will add automatic calibration--see <> for the status of this.)
Because the detection efficiency varies somewhat by color, an efficiency parameter is included in `ColorSpecification`. For instance, this efficiency can be used to convert the output of the tallying function from pixels to colored cubes.
Skeletal example code illustrating the tallying of colors in an image
---------------------------------------------------------------------
```haskell
main :: IO ()
main = do
input <- readRGB "data/sample.jpg"
print $ tally def input
let output = quantize def input
writeRBG True (Nothing, Nothing) "analysis.png" output
```