tdigest-Chart: Chart generation from tdigest


Downloads
- tdigest-Chart-0.tar.gz [browse] (Cabal source package)
- Package description (revised from the package)
Note: This package has metadata revisions in the cabal description newer than included in the tarball. To unpack the package including the revisions, use 'cabal get'.
Maintainer's Corner
For package maintainers and hackage trustees
Candidates
- No Candidates
| Versions [RSS] | 0, 0.2 |
|---|---|
| Change log | CHANGELOG.md |
| Dependencies | base (>=4.7 && <4.10), base-compat (>=0.9.1 && <0.10), Chart (>=1.8.1 && <1.9), colour (>=2.3.3 && <2.4), lens (>=4 && <4.16), semigroupoids (>=5.1 && <5.3), semigroups (>=0.18.2 && <0.19), tdigest (>=0.1 && <0.2) [details] |
| Tested with | ghc ==7.8.4, ghc ==7.10.3, ghc ==8.0.1, ghc ==8.0.2 |
| License | BSD-3-Clause |
| Author | Oleg Grenrus <oleg.grenrus@iki.fi> |
| Maintainer | Oleg Grenrus <oleg.grenrus@iki.fi> |
| Uploaded | by phadej at 2017-03-08T12:31:42Z |
| Revised | Revision 2 made by phadej at 2017-05-24T20:36:17Z |
| Category | Numeric, Graphics |
| Home page | https://github.com/futurice/haskell-tdigest#readme |
| Bug tracker | https://github.com/futurice/haskell-tdigest/issues |
| Source repo | head: git clone https://github.com/futurice/haskell-tdigest |
| Distributions | |
| Reverse Dependencies | 1 direct, 0 indirect [details] |
| Downloads | 1864 total (6 in the last 30 days) |
| Rating | (no votes yet) [estimated by Bayesian average] |
| Your Rating | |
| Status | Docs available [build log] Last success reported on 2017-03-08 [all 1 reports] |
Readme for tdigest-Chart-0
[back to package description]tdigest-Chart
Examples
These are outputs of the test-suite
inkscape --export-png=example1.png --export-dpi=80 --export-background-opacity=0 --without-gui example1.svg
inkscape --export-png=example2.png --export-dpi=80 --export-background-opacity=0 --without-gui example2.svg
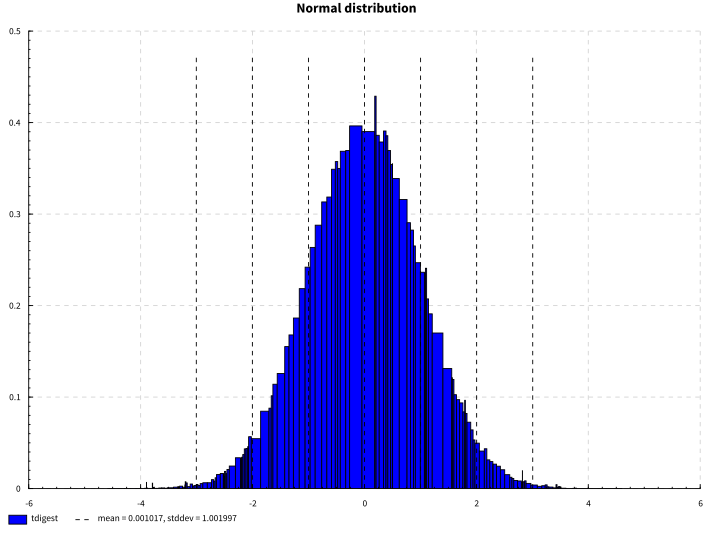
Standard normal distribution
Chart.layout_title Chart..= "Normal distribution"
Chart.plot $ do
    p <- Chart.tdigestPlot "tdigest" td
    return $ Chart.tdigestToPlot $ p
        & Chart.plot_tdigest_normalize .~ True
        & Chart.plot_tdigest_deviations .~ Just 3
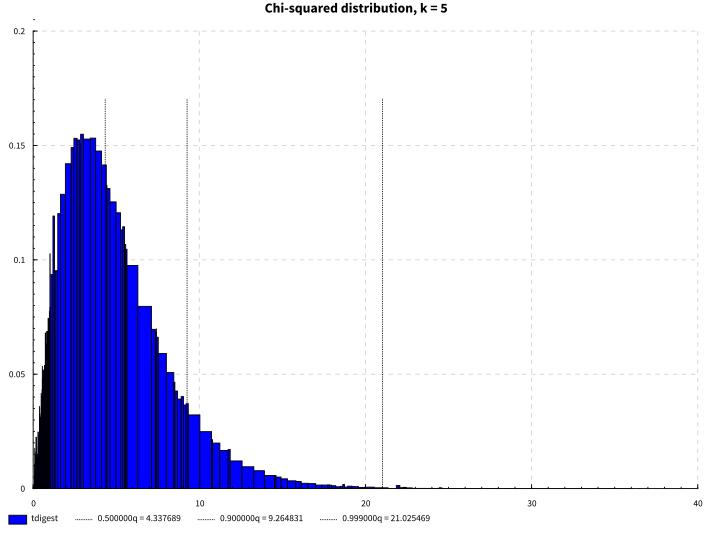
Chi-squared distribution, k = 5
Chart.layout_title Chart..= "Chi-squared distribution, k = 5"
Chart.plot $ do
    p <- Chart.tdigestPlot "tdigest" td
    return $ Chart.tdigestToPlot $ p
        & Chart.plot_tdigest_normalize .~ True
        & Chart.plot_tdigest_quantiles .~ [0.5, 0.9, 0.999]