tracy-profiler: Haskell bindings for Tracy frame profiler

Modules
[Index] [Quick Jump]
Flags
Manual Flags
| Name | Description | Default |
|---|---|---|
| enable | Enable to actually call the Tracy functions and produce data. Otherwise the wrappers will be no-ops. | Disabled |
| fibers | Enable if your libtracyclient has this enabled. | Disabled |
| has_callstack | Enable if your libtracyclient has this enabled. | Disabled |
| manual_lifetime | Manually manage profiler lifetime. Enable if your libtracyclient has this enabled. | Disabled |
| on_demand | Don't generate and keep events if there's no connection. Enable if your libtracyclient has this enabled. | Disabled |
| zones_pedantic | Crash when a zone is starting on an unbound thread. | Enabled |
| zones_unsafe | Skip the bound-thread check for zones. This may crash the profile server with "zone ended twice" error. | Disabled |
Use -f <flag> to enable a flag, or -f -<flag> to disable that flag. More info
Downloads
- tracy-profiler-0.1.2.1.tar.gz [browse] (Cabal source package)
- Package description (as included in the package)
Maintainer's Corner
For package maintainers and hackage trustees
Candidates
- No Candidates
| Versions [RSS] | 0.1.0.0, 0.1.1.0, 0.1.2.0, 0.1.2.1 (info) |
|---|---|
| Change log | CHANGELOG.md |
| Dependencies | base (>=4.16 && <5), bytestring, text (>=2.0 && <3), unliftio-core, webcolor-labels [details] |
| License | BSD-3-Clause |
| Copyright | 2025 IC Rainbow |
| Author | IC Rainbow |
| Maintainer | aenor.realm@gmail.com |
| Category | Profiling |
| Home page | https://github.com/haskell-game/tracy-profiler#readme |
| Bug tracker | https://github.com/haskell-game/tracy-profiler/issues |
| Source repo | head: git clone https://github.com/haskell-game/tracy-profiler |
| Uploaded | by AlexanderBondarenko at 2025-11-02T13:21:24Z |
| Distributions | |
| Downloads | 10 total (10 in the last 30 days) |
| Rating | (no votes yet) [estimated by Bayesian average] |
| Your Rating | |
| Status | Docs uploaded by user Build status unknown [no reports yet] |
Readme for tracy-profiler-0.1.2.1
[back to package description]tracy-profiler
Haskell bindings for Tracy frame profiler.
Setup
Installing
You can install the prebuilt package from your distribution if it has one:
sudo apt install libtracy-dev tracy-capture tracy-profiler
Or you can download and build one yourself and point your project to it:
# stack.yaml
extra-lib-dirs:
- upstream/_build/library
extra-include-dirs:
- upstream/tracy/public/tracy
You can use the provided Makefile that will do the thing:
make all # fetch and build stuff
make test # run the example
_build/profiler/tracy-profiler & disown # launch the profiler GUI
This way you can customize configuration. Make sure you update package flags to match.
Either way, you have to ensure that tracy-capture/tracy-profiler is built with the same version.
Otherwise it will connect and immediately refuse to record anything.
Flags
The flags must match whatever the library has been built with.
By default all the instrumentation wrappers do nothing.
That means you don't have to ifdef your code to remove the wrappers when they're not needed.
You have to set the enable flag in your project for the data to be collected.
flags:
  tracy-profiler:
    enable: true
    # manual_lifetime: false
    # fibers: false
Instrumentation
Use the functions from System.Tracy and System.Tracy.Zone to collect data:
{-# LANGUAGE MagicHash #-}         -- "static strings"#
{-# LANGUAGE OverloadedLabels #-}  -- #fuchsia colors
{-# LANGUAGE OverloadedStrings #-} -- "yes"

module Main where

import qualified System.Tracy as Tracy
import qualified Data.Text as Text

main :: IO ()
main = Tracy.withProfiler $ do
  Tracy.waitConnected_       -- wait for the tracy-capture to connect
  Tracy.withSrcLoc "main.nowhereInParticular" #f0fa do
    Tracy.messageL "hi there"# -- static strings require no copying to be logged
    mapM_ runFrame [0..600]

runFrame :: Int -> IO ()
runFrame ix = Tracy.withSrcLoc "runFrame" #fcc do
  Tracy.frameMark_
  let factorial = product [1 .. toInteger ix]
  let !digits = length (show factorial)
  Tracy.message . Text.pack $
    -- runtime strings will require some memcpy'ng around, use sparingly on hot paths
    "!" <> show ix <> " has " <> show digits <> " digits"
  Tracy.plotInt "digits"# digits
Collecting and viewing
Start tracy-capture before running the test to avoid empty areas where nothing happens:
tracy-capture -fo output.tracy &
Run the code, then upload the collected data to the viewer.
You'll see something like this:
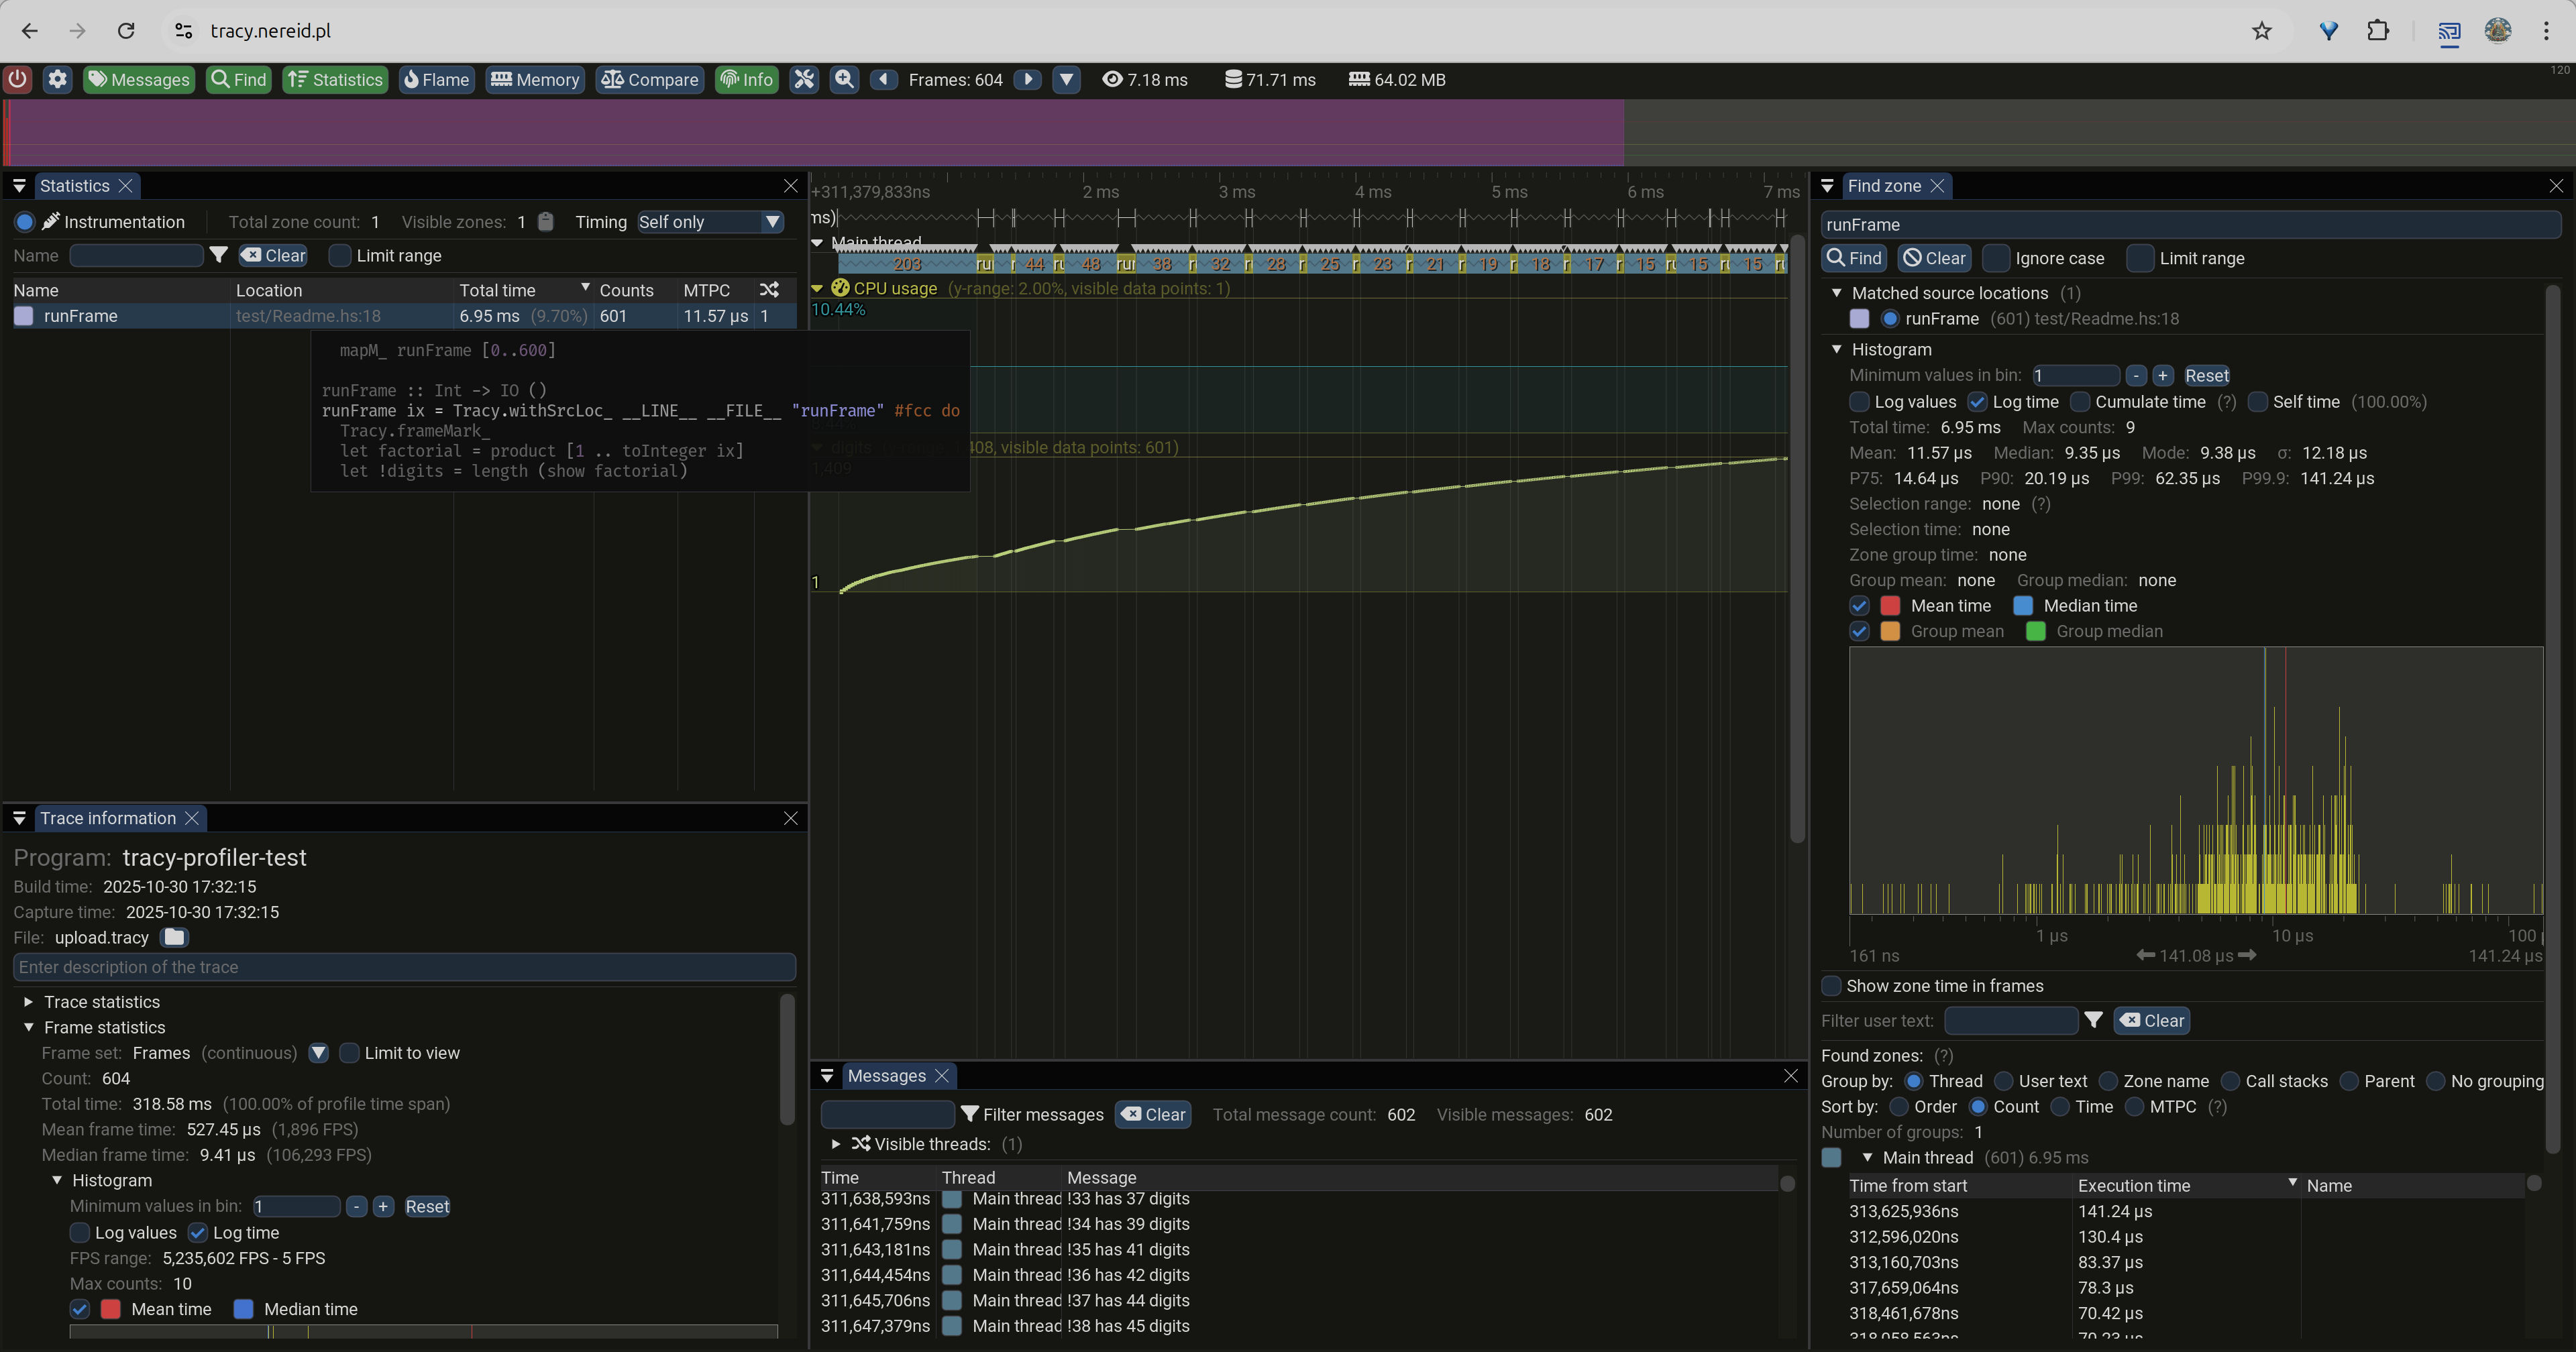
Are those are GC pauses we're looking at? 🤔
RTFM
You really should go read the official manual.
Yes, BEFORE you run into corrupted memory, surprising grouppings, or otherwise botched profiling runs.